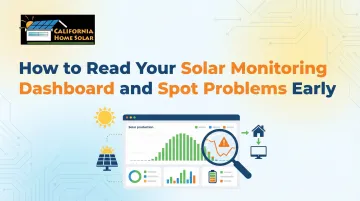
Introduction
Picture this: You're a Los Angeles homeowner scrolling through your solar monitoring app over morning coffee, staring at graphs and numbers you've never really understood. Is 4.2 kW good? Should yesterday's dip worry you? Most homeowners receive zero training on how to actually read their dashboard—yet this screen holds the key to catching expensive problems before they drain your savings.
This guide walks you through every critical metric on your dashboard, how to distinguish normal fluctuations from genuine faults, and how to catch issues before they cost you weeks of lost production. Whether you're using Enphase Enlighten, SolarEdge, or SMA Sunny Portal, you'll know exactly what to look for—and when to call your installer.
TL;DR
- Watch three core metrics: current power output (kW), energy produced (kWh), and system status alerts
- Healthy production curves form smooth bell shapes on sunny days—irregular dips or flat lines signal problems
- Compare today's output to the same period last year, not just yesterday
- Never dismiss persistent error codes as glitches—they always warrant investigation
- Unexplained underperformance that weather and shading don't account for needs professional diagnosis
Key Metrics on Your Solar Monitoring Dashboard
Understanding what each dashboard number actually measures is the foundation for catching problems. Homeowners who skip this step often panic over normal fluctuations or miss genuine issues entirely.
Current Power Output (kW)
This is your live snapshot—how many kilowatts your system generates right now. The most common mix-up is kW (your production rate at this instant) versus kWh (total energy accumulated over time)—two related but very different figures.
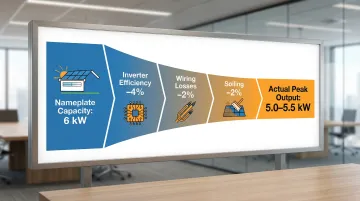
What's realistic? A 6 kW system on a clear Southern California afternoon will peak at 5.0-5.5 kW, not the full 6 kW. Real-world output runs 75-90% of nameplate capacity due to inverter efficiency (96%), wiring losses (2%), and soiling (2%). If your 6 kW system hits 5.2 kW at solar noon, that's healthy—not underperforming.
Daily and Lifetime Energy (kWh)
Your daily kWh counter tracks total production from sunrise to sunset. In Los Angeles, expect roughly 33 kWh per day from a typical 6 kW system (averaging across seasons). Southern California's 5.5 peak sun hours per day outperform the national average of 4.0 hours, so your daily totals should consistently beat systems in other regions.
The lifetime kWh figure tracks cumulative production since installation. Cross-check it against your original utility bills to confirm your actual savings match projections.
System Status and Alerts Panel
Status indicators vary by platform but follow similar patterns:
- Green/Active: System communicating and producing as expected
- Yellow/Warning: Minor issue detected, monitor closely
- Red/Fault: Serious problem requiring immediate attention
A communication error (gateway lost Wi-Fi) looks different than a production fault (inverter shutdown). The first may need just a router reboot; the second requires a service call. Enphase and SolarEdge dashboards clearly separate "offline" (data transfer issue) from actual system faults.
Performance Ratio (Where Shown)
Some platforms display a Performance Ratio (PR)—the percentage of actual output versus theoretical maximum given current sunlight conditions.
Healthy range: 0.75 to 0.90 (75-90%)
Warning sign: Consistent readings below 0.75 signal shading, heavy soiling, or equipment faults
PR naturally dips in summer heat—panels lose efficiency above 77°F—and recovers in winter despite shorter days.
How to Read Your Dashboard Step by Step
Most solar problems don't announce themselves — they show up as quiet dips in your data. Reading your dashboard well means working through three layers: today's output, historical trends, and individual component status.
Step 1 — Check Today's Production Curve
Pull up today's graph using your app's date-picker. On a clear day, you should see a smooth, symmetrical bell curve peaking at solar noon (around 1:00 PM). Overcast days show flatter, lower curves—that's normal.
Red flags on sunny days:
- Jagged, irregular peaks
- Flat-topped or cut-off curves
- Sudden mid-day drop-offs
Southern California context: Coastal LA's marine layer is common, especially during "June Gloom." Morning output stays suppressed until the clouds burn off between 9:00 AM and noon, then spikes — that's weather behavior, not a system fault.
Compare today side-by-side with a clear day from last week to spot genuine anomalies.
Step 2 — Review the Weekly and Monthly Trend
Navigate to your platform's monthly or historical view. Look for:
- Consistent weekly totals with gradual seasonal variation
- No sudden multi-day drops unexplained by weather
- Lower production in December-January, higher in May-June
Year-over-year comparison: Both Enphase and SolarEdge offer this feature. If this month's production runs 25% or more below the same month last year, investigate—that's beyond normal variation.
Step 3 — Check Panel-Level or String-Level Status
Once a trend anomaly catches your attention, the next step is tracing it to the source. Panel-level data tells you whether you're dealing with one faulty component or a wider issue.
Microinverter systems (Enphase): Show individual panel tiles with per-panel output. A dark or grayed-out tile means that specific panel is offline or underperforming.
String inverter systems: Display total string output only. A dip in string production indicates multiple panels in that string may be affected.
Once you've identified which panel or string is underperforming, you have what you need to report the issue accurately — whether that's to your monitoring platform's support or your installation contractor.
How to Interpret Your Readings: Normal, Warning, and Problem Signs
Misreading normal variation as a crisis—or dismissing a real problem as weather—are equally costly mistakes. Here's how to tell them apart.
Normal / Everything Is Fine
Healthy indicators:
- Smooth production curve matching weather conditions
- Daily kWh within expected seasonal range
- All panels/strings reporting
- No persistent alerts
- Performance ratio between 0.75-0.90
Day-to-day fluctuations of 10-20% due to clouds, haze, or temperature are normal. In Southern California, summer heat above 90°F can reduce afternoon output by 5-10%—this is normal panel behavior, not a fault.
Minor Issues / Worth Watching
Yellow flag scenarios:
- One panel consistently producing 10-15% less than neighbors (possible light soiling or partial shading)
- Monthly totals slightly lower than last year's same month
- Occasional communication gaps that self-resolve within hours
Appropriate response: Note the anomaly, check for obvious physical causes (debris, new tree growth), and monitor for 1-2 weeks. If the pattern continues or worsens, escalate.
Serious Problems / Act Now
Red flag readings requiring immediate action:
- Flat-line production on a sunny day (inverter failure or system shutdown)
- Multiple panels offline simultaneously
- Persistent error codes that don't clear after 24 hours
- Sudden production drop of 25%+ lasting beyond 3 days
Inverter error codes explained:
| Code | Cause | Risk Level |
|---|---|---|
| Grid Fault | Utility voltage or frequency out of spec | Low — often self-clears |
| Ground Fault | Insulation failure in wiring | High — shock hazard |
| Arc Fault | Electrical arcing in DC wiring | High — fire hazard |
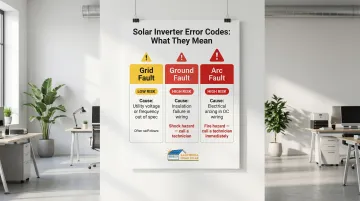
Do not attempt DIY fixes for Ground or Arc faults. These are serious safety hazards requiring licensed electrician diagnosis. For Los Angeles homeowners, CA Home Solar brings 36 years of local experience diagnosing and resolving these issues before they compound into larger losses. Call 877-903-1012 for professional assessment.
NEM 3.0 and Why Monitoring Matters More Than Ever in California
Under California's NEM 3.0 (Net Billing Tariff), the export rate for excess solar sent to the grid dropped approximately 75% compared to NEM 2.0. You now earn pennies per kWh exported versus the $0.30-$0.40/kWh retail rate you pay for grid power.
Under NEM 3.0, every kilowatt-hour lost to an undetected fault hits your bill directly—there's no favorable export credit to cushion the loss. Self-consuming every kWh your system generates is now critical. Catching problems early is the difference between a minor service call and months of lost savings.
Common Mistakes When Reading Your Solar Dashboard
Most dashboard misreads fall into predictable patterns. Knowing them saves you from unnecessary panic calls—or worse, ignoring real problems.
Three mistakes come up again and again:
- Comparing output across different seasons and drawing wrong conclusions
- Dismissing active alerts because overall production looks fine
- Confusing a communication outage with an actual panel failure
Comparing the Wrong Time Periods
Comparing a winter day's output to a summer day's output and concluding something is broken is one of the most common misreads. Valid comparisons use same-season, similar-weather periods. Your platform's year-over-year tool handles this automatically — December 2024 vs. December 2023, not December vs. June.
Ignoring Alerts Because the App Still Shows Some Production
A system can generate power while an active fault exists. A single offline panel or string won't zero out the whole system. Dismissing a persistent yellow or red alert because "the numbers look okay" is how minor issues become expensive repairs.
Rule: Investigate any alert that persists beyond 24 hours, regardless of production levels.
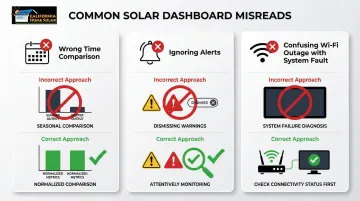
Mistaking a Wi-Fi or Communication Outage for a Production Problem
Lost internet connection causes monitoring data to go blank or show gaps, which looks alarming but doesn't mean your panels stopped working.
Quick check: Walk outside and verify your inverter's indicator lights are still green. If yes, your system is producing; only data transfer is interrupted. Reconnect your gateway to Wi-Fi to backfill the missing data.
Best Practices for Staying on Top of Your System
A few simple habits, done consistently, will catch problems faster than any occasional deep dive into your data.
Set a Simple Monitoring Routine
Realistic cadence:
- Daily (first year): 30-second glance confirming production is active
- Weekly: 5-minute review of production curve and any alerts
- Monthly: Thorough comparison against prior periods
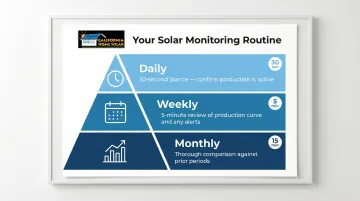
The first year after installation is the most important time to build this habit—you'll learn what "normal" looks like for your specific system and location.
Configure Alerts Proactively
Set up push notifications or email alerts in your monitoring app so the system flags issues automatically rather than relying on you to notice them manually.
Recommended threshold: Set a production alert at 15-20% below expected output. This catches real problems without spamming you for every passing cloud.
Schedule a Professional Annual Inspection
Monitoring catches electrical and performance anomalies, but it can't replace a hands-on inspection. Schedule one annually—ideally before California's summer peak production season (May–June). A trained technician will check for:
- Cracked or degraded panels
- Corroded connectors and loose wiring
- Debris accumulation blocking panel surfaces
- Mounting hardware wear or shifting
These are issues your dashboard simply won't surface on its own.
Conclusion
Master the three-level reading approach: check today's curve, review the trend, and inspect panel/string status. Catching a problem early through consistent monitoring typically prevents weeks of lost production and protects your financial returns under NEM 3.0's reduced export rates.
Most dashboard readings are good news. When you know what a healthy production curve looks like for your Southern California home, genuine warning signs stand out immediately. If persistent alerts or unexplained output drops show up, that's the moment to call a qualified installer — before a small issue compounds into a larger repair bill.
Frequently Asked Questions
How do I know if my solar system is working properly?
A working system shows an active production curve during daylight hours, a green or "normal" status in the monitoring app, and daily kWh totals consistent with the season and recent weather. If all three are present, your system is functioning as expected.
What should my solar controller read?
The inverter or controller should display "On" or "Normal" status, current power output (kW) tracking with sunlight conditions, and no active fault codes. Voltage (typically 240V AC) and frequency (60 Hz) should fall within manufacturer specs. Persistent deviations from either spec warrant a call to a licensed technician.
What is NEM 3.0 and how does it affect solar customers in California?
NEM 3.0 is California's current net metering policy, which reduced the credit rate for exported solar by roughly 75% compared to NEM 2.0. This makes maximizing self-consumption critical, since every kilowatt-hour lost to an undetected fault is no longer compensated at favorable rates.
Why is my solar production lower than expected?
Common causes include seasonal sun angle changes, weather (clouds, marine layer, haze), panel soiling, partial shading from new tree growth, or equipment issues. Check your dashboard's year-over-year comparison and any active alerts — these two data points usually clarify whether you're looking at weather or a real fault.
How often should I check my solar monitoring dashboard?
Quick daily glances during the first year help you learn normal patterns, then shift to weekly or monthly reviews once familiar. Setting up automated alerts handles most day-to-day monitoring automatically.
What do error codes on my solar monitoring app mean?
Error codes vary by manufacturer but typically signal communication failures, grid connection issues, ground faults, or arc faults. A one-time self-clearing code can usually be dismissed. Any code that persists or repeats should be reported to a licensed solar technician.