Introduction
Southern California homeowners face a frustrating paradox: you pay some of the nation's highest electricity rates while living under some of the country's most abundant sunshine.
SCE customers now pay approximately 35.3¢ per kWh, while LADWP base rates start at 7.14¢/kWh and climb steeply from there. Yet most homeowners still underestimate how much energy their roofs can actually capture.
The gap between potential and actual solar output often comes down to one overlooked number: peak sun hours. This isn't the same as total daylight — it's a precise measurement that directly determines your system's real-world energy output and savings potential.
This guide breaks down peak sun hours across key Southern California cities, shows you how to calculate real energy output for your specific location, and explains what these numbers mean for sizing a solar system. Even SoCal's lowest-sun cities outperform most of the U.S. — the entire region averages 5.5–6.5 peak sun hours daily, compared to a national average closer to 4.5.
TLDR
- Peak sun hours measure equivalent hours of full-intensity sunlight (1,000 W/m²), not total daylight
- Southern California cities receive 5.1–6.2+ peak sun hours daily vs. the 4.5 U.S. average
- Inland desert cities (Lancaster, Palmdale) get 0.7–1.0 more peak sun hours than coastal areas
- A 6kW system in Pasadena produces ~8,200 kWh/year; the same system in Santa Monica produces ~7,500 kWh/year
- SCE/LADWP rates average $0.30–$0.40/kWh — every panel-produced kWh carries more savings than nearly any other U.S. state
What Are Peak Sun Hours — and Why Do They Matter for Solar?
Peak sun hours aren't total daylight hours. A "peak sun hour" is a specific unit: one hour of sunlight at an intensity of 1,000 watts per square meter (W/m²) — the benchmark used to rate solar panel output.
If the sun shines at 500 W/m² for two hours, that equals just one peak sun hour. If you get 14 hours of daylight but the sun's intensity varies throughout the day, you might only receive 5-6 peak sun hours of equivalent full-power sunlight.
Solar panels are rated under Standard Test Conditions (STC) of 1,000 W/m², so a 400-watt panel produces 400 watt-hours in a single peak sun hour (before system losses). Peak sun hours are the multiplier that determines your real-world daily output — which is why your city's number matters more than your panel count alone.
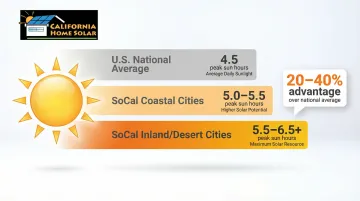
Southern California sits well above the national baseline. According to NREL's PVWatts database, here's how SoCal stacks up:
- U.S. national average: ~4.5 peak sun hours per day
- Southern California coastal areas: ~5.0–5.5 peak sun hours per day
- Inland and desert cities: 5.5–6.5+ peak sun hours per day
That 20–40% edge over the national average means 20–40% more energy from the same panels — a real difference in annual savings.
Peak sun hours also vary noticeably within SoCal. Inland desert cities outperform coastal zones, and mountain-adjacent areas land somewhere in between. Knowing your city's exact number is what separates an accurate system size from one that leaves money on the table.
Southern California City-by-City Peak Sun Hours Guide
Southern California's sun hours naturally cluster into three geographic zones, driven by distance from the coast and elevation. The marine layer — coastal fog that lingers through mid-morning — is the primary factor reducing peak sun hours near the ocean, while inland desert areas see clear skies most of the year.
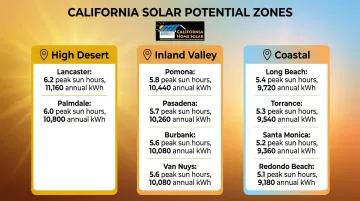
Zone 1: Antelope Valley / High Desert (Highest Solar Potential)
Cities in the Antelope Valley and high desert regions consistently rank highest in Southern California for solar production, often exceeding many Arizona cities.
Key cities and average daily peak sun hours:
- Lancaster: 6.2 kWh/kW/day
- Palmdale: 6.0 kWh/kW/day
These inland desert locations benefit from minimal marine layer influence, lower humidity, and higher elevation. A 6kW system in Lancaster produces approximately 8,900 kWh annually — enough to offset most residential electricity consumption entirely.
Zone 2: Inland and Valley Cities (Excellent Solar Potential)
Inland valleys represent the sweet spot for most LA-area homeowners, offering excellent solar resources significantly higher than the national average.
Key cities and average daily peak sun hours:
- Pomona: 5.8 kWh/kW/day
- Pasadena: 5.7 kWh/kW/day
- Burbank: 5.6 kWh/kW/day
- Van Nuys: 5.6 kWh/kW/day
- Northridge: 5.6 kWh/kW/day
- West Covina: 5.6 kWh/kW/day
A 6kW system in Pasadena produces approximately 8,200 kWh annually, well above the average Southern California household consumption of 6,000–7,200 kWh/year.
Zone 3: Coastal and South Bay Cities (Strong Solar Potential)
While coastal marine layer does reduce peak sun hours slightly compared to inland areas, these cities still far exceed national averages and deliver excellent solar ROI.
Key cities and average daily peak sun hours:
- Long Beach: 5.4 kWh/kW/day
- Torrance: 5.3 kWh/kW/day
- Santa Monica: 5.2 kWh/kW/day
- Redondo Beach: 5.1 kWh/kW/day
A 6kW system in Santa Monica produces approximately 7,500 kWh annually, still 15–20% above what the same system would produce in most other U.S. regions.
The table below consolidates all three zones for a quick side-by-side comparison.
City-by-City Production Comparison
| City | Zone | Avg. Daily Peak Sun Hours | Annual kWh (6kW System) |
|---|---|---|---|
| Lancaster | High Desert | 6.2 | ~8,900 |
| Palmdale | High Desert | 6.0 | ~8,600 |
| Pomona | Inland Valley | 5.8 | ~8,300 |
| Pasadena | Inland Valley | 5.7 | ~8,200 |
| Burbank | Inland Valley | 5.6 | ~8,000 |
| Van Nuys | Inland Valley | 5.6 | ~8,000 |
| Long Beach | Coastal | 5.4 | ~7,700 |
| Torrance | Coastal | 5.3 | ~7,600 |
| Santa Monica | Coastal | 5.2 | ~7,500 |
| Redondo Beach | Coastal | 5.1 | ~7,300 |
Data source: NREL PVWatts Calculator. Estimates assume south-facing roof, 34° tilt, and 86% system efficiency (14% total losses).
How to Calculate How Much Energy Your Solar Panels Will Produce
Use this formula to estimate your system's daily output:
System Size (kW) × Peak Sun Hours (hrs/day) × System Efficiency Factor = Daily kWh Output
Breaking down each variable:
- System Size: Sum of all panel wattages (e.g., 15 × 400W panels = 6kW)
- Peak Sun Hours: Your city's average from the table above
- System Efficiency Factor: Typically 80-86% (accounts for inverter losses, wiring resistance, soiling, and heat)
Example 1: 6kW System in Pasadena (Inland)
- System Size: 6kW
- Peak Sun Hours: 5.7 hrs/day
- Efficiency: 0.86 (14% losses)
Calculation:6kW × 5.7 hrs/day × 0.86 = 29.4 kWh/day29.4 kWh/day × 365 days = 10,731 kWh/year
Example 2: 6kW System in Santa Monica (Coastal)
- System Size: 6kW
- Peak Sun Hours: 5.2 hrs/day
- Efficiency: 0.86
Calculation:6kW × 5.2 hrs/day × 0.86 = 26.8 kWh/day26.8 kWh/day × 365 days = 9,782 kWh/year
Location difference: The same 6kW system produces approximately 950 kWh more per year in Pasadena than Santa Monica — a 9.7% difference driven entirely by geography.
Translating Output to Dollar Savings
Multiply annual kWh production by your utility rate:
Pasadena example (SCE customer at 35.3¢/kWh):10,731 kWh/year × $0.353/kWh = $3,788 annual savings
Santa Monica example (SCE customer at 35.3¢/kWh):9,782 kWh/year × $0.353/kWh = $3,453 annual savings
With SCE's high rates, even coastal systems deliver exceptional returns.
Temperature Efficiency Factor in SoCal
Those savings figures assume one important variable stays in check: heat. Solar panels are rated at 25°C (77°F), but SoCal inland summers regularly exceed 90-100°F. Most panels lose efficiency above their rated temperature — typically 0.35-0.47% per degree Celsius above 25°C.
On a hot summer day in Lancaster, panel surface temperatures can reach 65°C (149°F), causing a system to lose 15-20% of its rated power output temporarily. Coastal cities like Santa Monica benefit from ocean breezes that keep panels cooler, preserving efficiency during peak sun hours.
This temperature effect is already built into NREL's annual averages and the 14% system loss assumption. It explains why inland systems, despite more peak sun hours, don't pull as far ahead of coastal systems as the raw numbers might suggest.
What Else Affects Solar Panel Production in Southern California?
Roof Orientation and Tilt
South-facing roofs at approximately 18-34° tilt (matching Southern California's latitude range of 33-34°N) capture the most annual sunlight. This orientation maximizes exposure to the sun's path across the southern sky throughout the year.
West-facing roofs — common in many LA neighborhoods — can still perform well and may actually benefit from afternoon production that aligns with peak Time-of-Use (TOU) rate periods under SCE and LADWP billing structures. If your utility charges higher rates from 4-9 PM, west-facing panels producing during those hours offset your most expensive electricity.
Shading Impact
Even partial shading from trees, chimneys, or neighboring buildings can significantly reduce output. The impact depends on your inverter technology:
| Inverter Type | How Shading Affects Output |
|---|---|
| String inverters | Shading one panel can cut the entire string's output by 5-25% annually — all panels are wired in series |
| Microinverters & power optimizers | Each panel operates independently, recovering measurably more energy in shaded conditions |
If your roof has unavoidable shading, module-level power electronics are essential for maximizing production.
California Home Solar installs both Enphase microinverters and SolarEdge power optimizers as alternatives to traditional string inverters, ensuring optimal performance even on complex rooftops with shading challenges.
Coastal Marine Layer (June Gloom)
The June Gloom phenomenon — persistent morning marine layer in coastal LA cities from May through July — can reduce effective peak sun hours during those months compared to annual averages. Coastal systems may see a 15-20% reduction in daily production during peak marine layer months.
NREL's multi-year averages already account for this seasonal dip. The rest of the year is predominantly clear, so annual production averages remain strong — and panels still make strong economic sense on the coast, especially given SCE's high rates.
How to Right-Size Your Solar System for Your Southern California Home
Start With Your Energy Consumption
Pull 12 months of utility bills to find your average monthly kWh usage. According to EIA data, the average Southern California home uses approximately 503-600 kWh per month (6,000-7,200 kWh/year) — significantly lower than the U.S. average of 860-890 kWh/month due to milder weather and California's energy efficiency standards.
If your home has high-draw appliances like electric vehicle chargers, pool pumps, or older HVAC systems, your consumption may be higher.
Apply the Sizing Formula
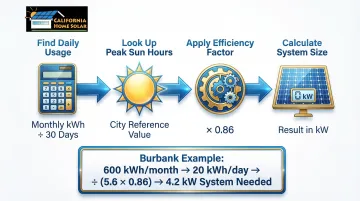
Formula: (Monthly kWh ÷ 30 days) ÷ (Peak Sun Hours × 0.86 efficiency) = Required System Size in kW
Example: Burbank homeowner using 600 kWh/month
- Daily consumption: 600 kWh ÷ 30 = 20 kWh/day
- Peak sun hours: 5.6 hrs/day
- Required system size: 20 kWh/day ÷ (5.6 × 0.86) = 4.2 kW system
This homeowner would need approximately 11 panels at 400W each (4.4kW total) to offset their entire electricity bill.
Professional Assessment Matters
Simple math gets you close, but accurate sizing depends on property-specific factors:
- Roof size, orientation, and shading patterns
- Structural capacity and condition
- Current energy use and planned additions (EVs, pool pumps, HVAC upgrades)
- Local permitting requirements
California Home Solar has handled residential solar assessments across Los Angeles County for 36 years. Their free site assessment covers roof condition, energy usage analysis, and a detailed proposal with savings projections, financing options, and installation timelines. Call 877-903-1012 to schedule yours.
Why Southern California Remains One of the Best Regions in the U.S. for Solar
High Electricity Rates Amplify Savings
SCE customers face average residential rates of 35.3¢/kWh as of early 2026, among the highest in the nation. LADWP customers pay base energy charges starting at 7.14¢/kWh for Tier 1 usage, with costs increasing significantly in higher tiers and during high-demand seasons.
Every kWh your solar panels produce saves more money here than in most other states. A system producing 8,000 kWh/year saves an SCE customer $2,824 annually at current rates, compared to just $1,120 annually in a state with 14¢/kWh rates. SoCal's ROI is among the best nationally, with most systems paying for themselves in 5-7 years.
Available Incentives Stack Up
Three incentives make SoCal solar economics hard to beat:
- Federal Investment Tax Credit (ITC): The Residential Clean Energy Credit stays at 30% through 2032. Homeowners deduct 30% of total system cost, including installation, directly from their federal income taxes.
- California Property Tax Exclusion: Solar installations are excluded from increasing your home's assessed value. This exclusion is active through the 2025-2026 fiscal year and sunsets on January 1, 2027, so timing matters.
- Net Metering: SCE customers now fall under the Solar Billing Plan (NEM 3.0), which credits exported energy at an avoided-cost rate rather than full retail. Export credits are lower than under previous programs, but high retail rates and the 30% ITC still deliver strong ROI, particularly when paired with battery storage. LADWP customers remain on a separate program with more favorable export economics than NEM 3.0.
Frequently Asked Questions
What percentage of California's energy comes from solar?
Solar energy accounted for approximately 19% of California's total in-state electricity generation in 2023, making it the largest renewable source in the state. When including both utility-scale and small-scale residential solar, the combined share reached nearly 32% of total generation in 2024.
What are the peak sun hours for solar panels?
Peak sun hours measure equivalent full-intensity sunlight at 1,000 W/m², not total daylight hours. Southern California cities generally receive 5.1 to 6.2+ peak sun hours per day — inland desert areas rank highest, while coastal cities average slightly less but still outpace the U.S. average of 4.5.
Is 10 kW enough to run a house?
For most SoCal homes, a 10kW system exceeds typical consumption of 6,000-7,200 kWh/year. In Pasadena (5.7 peak sun hours), it generates roughly 17,900 kWh annually, which is more than double average household use. Actual sufficiency depends on high-draw appliances like EVs or pools.
Which Southern California city gets the most peak sun hours?
Cities in the Antelope Valley — Lancaster and Palmdale — consistently receive the most peak sun hours in the region, with Lancaster averaging 6.2 kWh/kW/day. These high-desert areas benefit from minimal marine layer, lower humidity, and clear desert skies year-round.
Does the coastal marine layer reduce solar panel output in LA?
Yes, the June Gloom marine layer does reduce output in coastal cities during late spring and early summer, with production dropping 15-20% during those months. However, annual production averages remain strong because the rest of the year is predominantly clear, and coastal cities still exceed the national average by 10-20%.
How many solar panels do I need for a typical Southern California home?
Most SoCal homeowners need 15-25 panels to offset typical annual consumption of 6,000-7,200 kWh, with the exact count depending on panel wattage and your city's sun hours. For a precise estimate based on your actual usage, California Home Solar offers free assessments — call 877-903-1012.