Introduction
SCE, LADWP, and SDG&E rates have climbed an average of 10% annually since 2020—and for Southern California business owners, that sustained increase is compressing margins in ways that are hard to offset. Commercial solar promises relief, but most owners hesitate to commit six figures without seeing real numbers first.
This breakdown delivers exactly that: actual system costs, stacked California incentives, and worked payback calculations so you can gauge what solar would realistically return for a business like yours. Southern California's combination of high utility rates and a solar incentive stack that can cut effective system cost by nearly half puts commercial owners here in an unusually strong ROI position.
TLDR:
- Commercial solar payback in Southern California typically ranges from 3-5 years for for-profit businesses
- Federal ITC (30%) plus MACRS depreciation can reduce effective system cost by 46-50%
- Solar can cut demand charges that make up 30-70% of commercial utility bills
- After payback, systems generate essentially free electricity for 20+ additional years
- Battery storage under NEM 3.0 is now essential for maximizing ROI with SCE and SDG&E
What Does Commercial Solar ROI Actually Mean for a Business?
Commercial solar ROI isn't a single number—it's three distinct metrics that tell different parts of the financial story.
The Three Core Metrics:
- Payback period: How long until the system pays for itself
- Annual ROI percentage: Your yearly return compared to other capital investments
- Lifetime savings: Total dollars recaptured over a 25-30 year system life
Unlike residential solar, commercial properties enjoy more favorable ROI calculations because businesses benefit from additional tax mechanisms. The Modified Accelerated Cost Recovery System (MACRS) allows you to depreciate the system over five years, while energy costs remain fully deductible as business expenses. Together, these mechanisms can reduce your effective net cost by 40–50% before you generate a single kilowatt-hour.
Unlike market investments, commercial solar returns are largely predictable—tied to known utility rate trends and fixed installation costs. SCE rates have climbed roughly 10% annually for four consecutive years. Locking in your energy costs now converts an escalating operating expense into a fixed, declining one.
Real Cost Numbers: What California Businesses Pay for Commercial Solar
System Pricing by Size
Commercial solar in Southern California currently ranges from $2.55 to $3.42 per watt installed, depending on system size. Here's what that translates to for common business installations:
- 50 kW system: $128,000 - $171,000
- 100 kW system: $255,000 - $342,000
- 250 kW system: $638,000 - $855,000
Larger systems capture better economies of scale. A 100-500 kW installation averages $2.55/watt, while smaller 10-100 kW systems typically cost $3.42/watt.
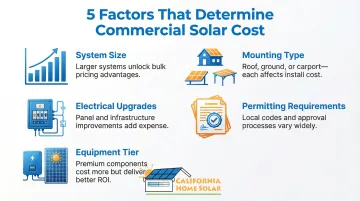
What Drives Cost Variation
Five factors determine where your project lands within these ranges:
- Larger panel counts lower per-watt costs through bulk purchasing and faster installation
- Mounting type matters — rooftop is standard, ground-mount suits properties with limited roof space, and carports add parking value but carry higher structural costs
- Older buildings often need electrical panel upgrades or service entrance work before interconnection
- Permitting timelines and requirements vary significantly across LA County jurisdictions
- Premium modules with microinverters or power optimizers cost more than standard panels with string inverters
The Demand Charge Factor
Here's what most business owners miss: commercial utility bills aren't just about consumption. Demand charges—fees based on your peak usage—account for 30-70% of commercial electricity bills in California.
Two major Southern California utilities structure these charges differently:
- SCE (TOU-GS-2): Charges both Facilities-Related Demand (FRD) fees based on your highest usage anytime, and Time-Related Demand (TRD) fees tied to peak windows
- LADWP (Rate A-2): Applies summer demand charges of $10.00/kW during high-peak periods
Solar meets daytime demand with on-site generation, cutting these charges substantially and boosting savings beyond what you'd calculate from energy usage alone.
Baseline Electricity Costs
To understand the savings potential, start with what you're currently paying. A mid-size Southern California commercial property — a small office building or retail space — typically runs:
- Monthly: $2,000 to $8,000 depending on square footage and operations
- Annually: $30,000 to $100,000+
Without solar, a business spending $50,000 annually on electricity will pay $500,000 over 10 years at flat rates. Factor in California's historical rate increases averaging 5-10% annually, and that cumulative cost climbs closer to $800,000.
California's Solar Incentives: How They Stack to Cut Your Costs
Federal Investment Tax Credit (ITC)
The ITC delivers a 30% direct tax credit against federal tax liability through 2032. Unlike a deduction that lowers taxable income, this is a dollar-for-dollar reduction of what you owe the IRS.
Example: On a $300,000 system, the ITC provides $90,000 in tax savings in year one.
Projects over 1 MW can qualify for additional 10% adders through Domestic Content requirements or siting in designated Energy Communities, potentially pushing the credit to 50%.
MACRS Bonus Depreciation
Commercial solar qualifies for five-year MACRS depreciation, but there's an accelerated component that's phasing down:
- 2024: 60% bonus depreciation
- 2025: 40% bonus depreciation
- 2026: 20% bonus depreciation
That phase-down matters: a system placed in service in 2025 allows 40% of the cost basis to be deducted immediately, with the remainder following the five-year schedule.
Important: When claiming the ITC, you must reduce the depreciable basis by half the ITC value. For a 30% ITC, this means 85% of total system cost can be depreciated.
Self-Generation Incentive Program (SGIP)
SGIP provides rebates for battery storage paired with solar—critical for maximizing returns under NEM 3.0. Current rates:
- Large-scale storage (general market): $0.25/Wh
- Large-scale storage (claiming ITC): $0.18/Wh
- Equity Resiliency (critical facilities in fire zones): $1.00/Wh
Battery storage enables businesses to store solar generation and discharge it during expensive peak periods, cutting both Time-of-Use charges and demand charges on their bill.
That storage value is tied directly to how your utility credits excess solar — and the rules vary significantly depending on who your provider is.
Net Energy Metering: SCE/SDG&E vs. LADWP
| SCE / SDG&E (NEM 3.0) | LADWP | |
|---|---|---|
| Export credits | Avoided-cost rates (well below retail) | Retail rate credit for systems under 1 MW |
| Battery essential? | Yes — solar-only returns are significantly reduced | Less critical, but still beneficial |
| Multi-meter option | Standard NEM | VNEM available; 40% of proceeds must go to tenants |
| Governing body | CPUC | Independent municipal utility |
Under NEM 3.0 (SCE and SDG&E), the Net Billing Tariff has been in effect since April 2023. For LADWP customers, traditional NEM rules remain in place — a meaningful advantage if you're in their service territory.
The Stacking Effect
Here's how incentives combine to slash effective cost on a $300,000 system (placed in service in 2025):
- Gross cost: $300,000
- SGIP rebate (100 kWh storage @ $0.18/Wh): -$18,000
- Federal ITC (30%): -$90,000
- MACRS depreciation tax savings (21% corporate rate): -$53,550
- Effective net cost: ~$138,450
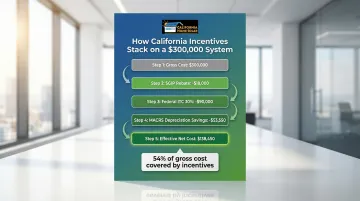
Combined, those incentives cover 54% of the gross system cost — and that's before calculating ongoing utility savings, which is where payback timelines get interesting.
How to Calculate Your Payback Period: A Step-by-Step Example
The Formula
Payback Period = Net System Cost After Incentives ÷ Annual Utility Savings
Let's work through a realistic Southern California scenario: a 100 kW system for a small LA-area business.
Worked Example: 100 kW System
System specifications:
- Installed cost: $255,000 (at $2.55/watt median)
- Location: Los Angeles (6.21 kWh/m² daily solar radiation)
- Annual production: 160,000 kWh (1,600 kWh per kW)
Cost after incentives:
- Gross cost: $255,000
- Federal ITC (30%): -$76,500
- MACRS depreciation savings: -$45,500
- Net cost: $133,000
Annual savings calculation:
- SCE commercial rate (blended): $0.18/kWh
- Annual electricity offset: 160,000 kWh × $0.18 = $28,800
- Demand charge reduction: ~$6,000
- Total annual savings: $34,800
Payback period: $133,000 ÷ $34,800 = 3.8 years
Utility Provider Comparison
Payback periods vary by utility due to different rate structures:
- SCE territory: 3-5 years (high TOU rates and demand charges accelerate returns)
- LADWP territory: 4-6 years (municipal rates slightly lower but still favorable)
- SDG&E territory: 3-4 years (highest rates in the state deliver fastest payback)
Tax status also affects the timeline. For-profit businesses achieve payback faster due to full ITC eligibility, though the IRA's Elective Pay provision now allows tax-exempt entities to claim the full ITC value as a direct cash payment.
What Happens After Payback
Once the system pays for itself—typically within 3-5 years for Southern California commercial customers—the electricity it generates costs nothing in fuel for the remaining 20+ years of the system's warranted life.
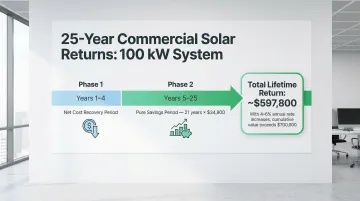
Lifetime value calculation:
- Years 1-4: Net cost recovery period
- Years 5-25: Pure savings period (21 years × $34,800 = $730,800)
- Total lifetime return: ~$597,800 (after recovering initial $133,000 net investment)
Factor in California's historical utility rate increases — averaging roughly 4–6% annually over the past decade — and the cumulative value climbs well above $700,000 over 25 years. Businesses that install now lock in today's economics while future energy costs remain unpredictable.
Factors That Accelerate (or Slow) Your Solar ROI in Southern California
ROI Accelerators
Five characteristics signal strong commercial solar returns in the LA area:
- Businesses paying $0.18–0.25/kWh see faster payback than those with negotiated rates
- Retail stores, restaurants, and day-shift warehouses maximize self-consumption and demand charge reduction
- Large flat roofs or parking lots allow optimal system sizing without design constraints
- For-profit tax status unlocks full ITC and MACRS eligibility for maximum incentive value
- SCE and SDG&E service territories carry higher rates and steeper demand charges than most municipal utilities
ROI Decelerators
Certain factors require extra analysis or may extend payback periods:
- Shaded or complex rooftops reduce panel output; power optimizers help but add 15–20% to hardware costs
- Non-profit or government entities historically had limited ITC access — the IRA's Elective Pay provision now allows tax-exempt organizations to claim full credit value as direct cash payment
- Loans above 6–7% increase total cost and extend payback compared to cash purchases
- Businesses with minimal energy use have a smaller annual savings base, which compresses overall ROI
System Degradation Reality
Long-term output holds up better than most buyers expect. Tier-1 commercial panels degrade at a median rate of 0.5% per year, meaning a system installed today still runs at roughly 87% capacity at year 25. NREL's 2024 research puts modern module degradation at 0.35–0.55% annually — well within the warranty specifications that guarantee 80–85% output after 25 years.
In practical terms: annual savings dip only slightly over time, while utility rates keep rising. That gap between what you produce and what grid power costs is what drives long-term returns.
Financing Options and How They Impact Your ROI
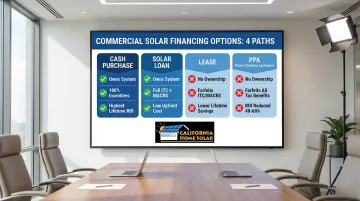
The Four Paths
Cash purchase - Highest lifetime ROI. You capture 100% of incentives and eliminate interest costs. Best for businesses with available capital or strong cash reserves.
Solar loan - Strong ROI with minimal upfront capital. Monthly payments are typically offset by immediate utility savings, and you still own the system and claim ITC plus MACRS benefits. SBA 504 Green Energy loans are one strong option for financing this path (details below).
Lease - Third party owns the system; you make fixed monthly payments. No upfront cost, but you forfeit ITC and MACRS benefits (retained by lessor). Lifetime savings significantly lower than ownership.
Power Purchase Agreement (PPA) - Third party owns the system; you buy the electricity at a lower rate than utility charges. No upfront cost or maintenance responsibility, but you forfeit all tax benefits. Lifetime ROI reduced by 40-60% compared to direct ownership.
The Ownership Advantage
California Home Solar works exclusively with purchase transactions—cash or loan—rather than third-party ownership models. Leases and PPAs transfer the ITC and MACRS benefits to the system owner, not your business—and those benefits typically represent 50% of system value.
Under a lease or PPA, the third party captures those tax benefits while passing through only a portion of the savings. Ownership keeps the full financial upside with your business.
Commercial Loan Programs
If you're financing ownership rather than paying cash, two programs stand out for California commercial projects:
- SBA 504 Green Energy Program: Up to $5.5 million per project, fixed-rate, with only 10% down and terms up to 25 years — designed specifically for renewable energy investments
- C-PACE financing: Repayment runs through your property tax bill; rates and availability vary by California jurisdiction
- Business loan interest deduction: Interest paid on solar loans is tax-deductible, lowering the effective financing cost further
Frequently Asked Questions
What is the payback period for commercial solar panels?
For Southern California for-profit businesses, payback typically ranges from 3 to 5 years depending on utility provider, system size, and incentives claimed. After payback, the system generates near-zero-cost electricity for 20+ additional years, backed by 25-year panel warranties.
Is commercial solar profitable?
Yes, commercial solar is profitable for most California businesses. Annual electricity savings often outpace the cost of capital within 3-5 years, and lifetime returns can reach 4-8 times the original investment when federal ITC and MACRS depreciation benefits are factored in alongside decades of utility bill savings.
What are the incentives for businesses in California solar system?
Key incentives include the 30% Federal Investment Tax Credit (direct tax credit on installation cost), MACRS five-year accelerated depreciation with bonus provisions, SGIP rebates for battery storage ($0.18-1.00/Wh), and net energy metering credits that vary by utility. These stack to reduce effective system cost by 46-54%.
How much does a commercial solar system cost in California?
Commercial installations range from $2.55 to $3.42 per watt depending on system size and complexity. A typical 100 kW system costs $255,000-$342,000 before incentives. After federal ITC and MACRS depreciation, effective out-of-pocket cost drops to approximately $130,000-$175,000.
Does commercial solar increase property value?
Yes, owned solar systems increase assessed value by reducing operating expenses and improving Net Operating Income (NOI). Energy savings make the property more attractive to buyers and tenants. Leased systems don't transfer this benefit — the equipment stays with the third-party owner.
What financing options are available for commercial solar in California?
The four main options are cash purchase (highest ROI), solar loans (including SBA 504 Green Energy financing), leases, and Power Purchase Agreements (PPAs). Cash and loan structures let businesses claim federal tax credits and depreciation directly. Leases and PPAs transfer those benefits to the third-party owner in exchange for lower upfront costs.
Ready to see your specific numbers? California Home Solar offers no-obligation commercial ROI consultations — a customized analysis covering your property, energy usage, and utility provider. With 36 years of experience serving Southern California businesses, we deliver transparent, accurate projections so you can make a fully informed decision. Contact us at 877-903-1012 or visit our Sherman Oaks office to discuss how solar can reduce your operating costs and hedge against rising utility rates.